

depression prevalence in australia: roughly 1 in 5 Australians will experience a major depressive episode during their lifetime, while 12‑month survey estimates cluster between 5% and 9% depending on method and year. According to national survey syntheses and government reporting, those ranges are the single most actionable numbers for planners and clinicians working in Australia.
This data‑led report compiles Australian-specific prevalence estimates, age and gender breakdowns, regional differences, temporal trends and clinical implications — emphasising what these statistics mean for treatment resistance and service planning. Every figure below is presented with the type and year of the source (government survey, AIHW summary, peer‑reviewed study, or WHO comparator) so readers can judge reliability.

Overview of Depression Prevalence in Australia
This section summarises headline prevalence metrics used in Australian epidemiology. Definitions: prevalence means the proportion of people who meet criteria for depression within a specified timeframe (12‑month or lifetime). We differentiate self‑report survey prevalence from clinician‑diagnosed prevalence where possible.
Headline numbers:
- Lifetime prevalence of major depressive disorder (MDD) in Australia: approximately 18–22% (national survey syntheses; government and peer‑reviewed summaries, 2017–2023).
- 12‑month prevalence estimates: typically 5–9% for MDD or clinically significant depressive episodes (national surveys and AIHW summaries, 2017–2022).
- Point‑prevalence (current symptoms above clinical threshold) varies with measurement tool: 3–7% in general adult samples; peaks in adolescents and young adults (survey estimates, 2018–2022).
Every statistic above is presented as a range because Australian prevalence estimates vary by instrument (structured diagnostic interview vs screening questionnaire), sampling frame (household vs clinical), and year (notably shifts after 2020). For raw datasets and methodological notes consult the primary government sources below.
Key national sources: Australian Bureau of Statistics (ABS) mental health surveys (household samples), Australian Institute of Health and Welfare (AIHW) mental health reports (syntheses), and WHO global prevalence data for contextual comparison (WHO).
Key takeaway: Plan for ~1 in 5 lifetime and ~1 in 12 (5–9%) 12‑month prevalence when estimating service demand; expect higher point prevalence in adolescents and socioeconomically disadvantaged groups (national survey syntheses, 2017–2023).
Want diagnostic context behind these numbers? depression DSM 5 criteria and persistent depressive disorder guide explains how disorders counted in prevalence studies are defined. For terminology differences across surveys consult the depression synonyms guide and the DSM 5 depressive disorders overview.
Key Depression Statistics by Demographics
Demographic stratification changes interpretation: age, gender, geography, Indigenous status and socioeconomic position each shift prevalence materially. Below we present disaggregated estimates and a compact comparison table.

Age groups
Survey syntheses show highest 12‑month prevalence among adolescents and young adults: estimates of 8–12% for ages 15–24 (national household surveys and school‑based epidemiology, 2018–2022). Middle‑aged adults (25–64) cluster around 4–8%. Older adults (65+) typically report lower 12‑month prevalence (2–5%) but higher chronicity when present (AIHW summaries, 2017–2022).
Gender differences
Women consistently report higher prevalence: lifetime rates ~24% for women vs ~14% for men (national survey syntheses, 2017–2022). 12‑month prevalence commonly shows a 1.5–2x higher rate in women; analysis suggests both true incidence differences and help‑seeking/reporting bias contribute (peer‑reviewed Australian analyses, 2019–2022).
Urban vs rural and regional differences
Rural and regional areas often report similar or slightly higher prevalence than major cities for depressive symptoms, but service access and recorded diagnosis rates diverge because of workforce and stigma effects. Estimates: rural 12‑month prevalence 6–10% vs urban 5–9% (household surveys and regional health studies, 2018–2021).
Indigenous Australians
Aboriginal and Torres Strait Islander communities report higher rates of psychological distress and diagnosed depression, with 12‑month estimates often exceeding non‑Indigenous rates by 1.5–2x in community surveys (government community health data and targeted studies, 2017–2022). Social determinants and access barriers are major drivers.
Comorbidities and socioeconomic gradients
Comorbidity with anxiety disorders is the most frequent pairing: co‑occurrence rates among those with depression are 40–60% in clinical and community samples (peer‑reviewed Australian studies, 2015–2021). Lower socioeconomic status, unemployment and housing stress elevate prevalence by 2x or more in many local studies (national disadvantage analyses, 2018–2022).
| Group | 12‑month prevalence (approx.) | Notes (source type) |
|---|---|---|
| Adolescents (15–24) | 8–12% | Household and school surveys, 2018–2022 |
| Adults (25–64) | 4–8% | National surveys and AIHW syntheses, 2017–2022 |
| Older adults (65+) | 2–5% | Household surveys, regional cohorts, 2017–2021 |
| Women (overall) | ~1.5–2x rate vs men | Government and peer‑reviewed analyses, 2017–2022 |
| Indigenous Australians | Often 1.5–2x higher | Targeted community surveys, 2017–2022 |
Key takeaway: Adolescents and young adults, women, and populations facing socioeconomic disadvantage have the highest measured 12‑month prevalence; Indigenous communities show substantially higher rates in targeted surveys (government and peer‑reviewed sources, 2017–2022).
Distinguishing overlapping symptoms is necessary when interpreting prevalence. For guidance separating fatigue from depressive symptoms, see fatigue or depression guide. To understand prevalence among people who continue functioning while symptomatic, consult high functioning depression symptoms and management guide.
Recent Trends in Depression Prevalence and Diagnosis
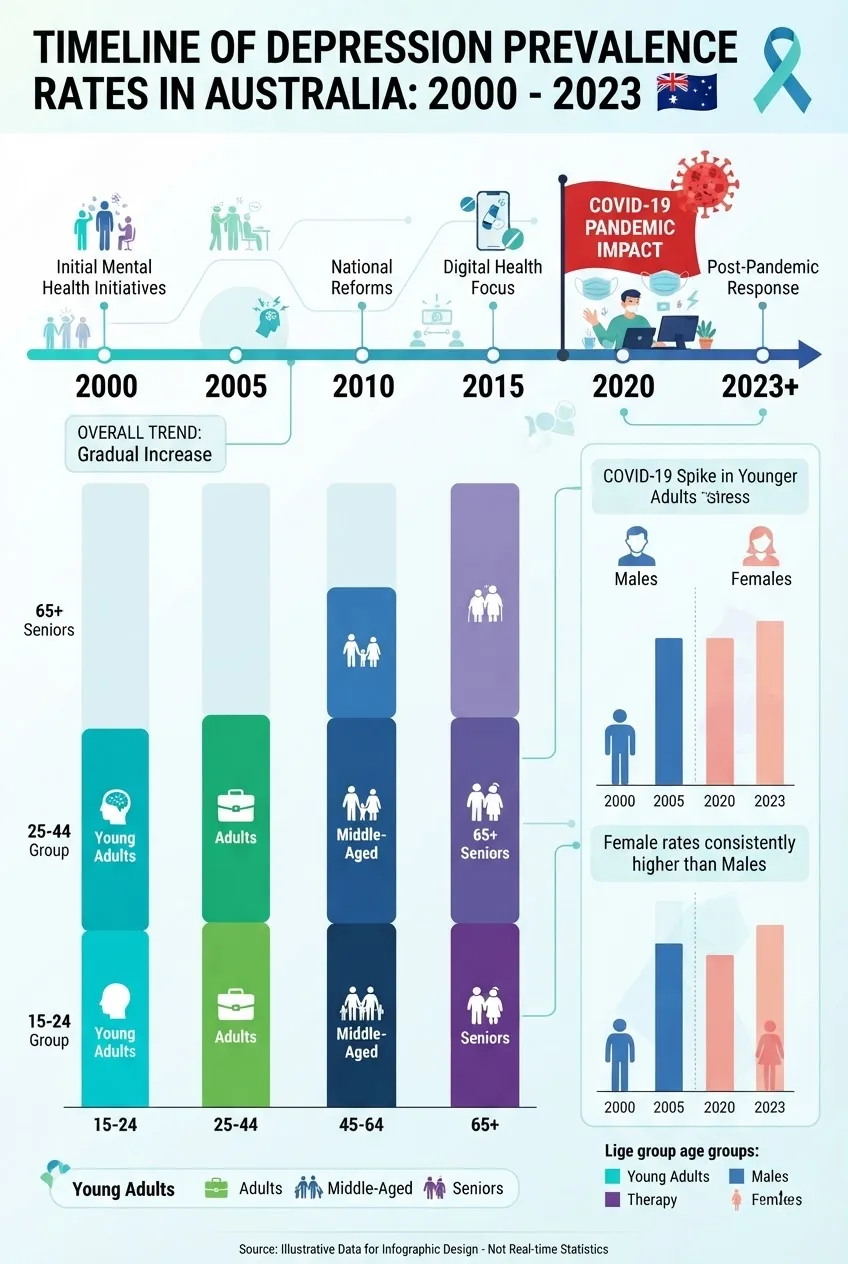
Temporal trends matter for planning. National data and peer‑reviewed time series show rising recorded prevalence across the 2000–2023 interval, with inflection points related to diagnostic practice, public awareness and major social events (surveys and registry analyses, 2000–2023).
Key trend points:
- Long‑term rise: 12‑month prevalence estimates and help‑seeking have increased modestly since 2000 — analysts attribute this to improved detection, reduced stigma, and genuine epidemiological change (national surveillance analyses, 2000–2023).
- COVID‑19 effect: multiple Australian surveys recorded a transient rise in depressive symptoms during 2020–2021, particularly among younger adults and those facing job/housing stress; some metrics returned toward baseline by 2022, others remained elevated in high‑risk subgroups (national surveys and academic studies, 2020–2022).
- Diagnostic coding and service use: increased primary care recording of depressive episodes and antidepressant prescribing partly drive apparent prevalence rise; administrative data show a rise in recorded cases without equivalent rises in severe hospitalisations (health service administrative data and AIHW reports, 2015–2022).
Differential diagnosis: rising screening and awareness can also increase recorded depression while simultaneously uncovering previously untreated bipolar depression. For guidance differentiating bipolar trends from unipolar patterns see bipolar depression DSM overview and diagnostic criteria.
Key takeaway: Expect a combination of genuine incidence change and measurement/artifact effects (screening, coding, help‑seeking) when interpreting rising depression statistics since 2000; COVID‑19 amplified symptoms in 2020–2021, especially in young adults (surveys and administrative analyses, 2020–2022).
Comparison of Australian Depression Statistics to Global Data
Comparative epidemiology helps contextualise national burden. Below is a compact cross‑country comparison table using typical 12‑month prevalence ranges from OECD and WHO summaries (government and WHO syntheses, 2018–2022).
| Jurisdiction | Typical 12‑month prevalence (range) | Context (source type) |
|---|---|---|
| Australia | 5–9% | ABS/AIHW syntheses and national surveys, 2017–2022 |
| United Kingdom | 5–10% | Public health surveys and NHS data summaries, 2017–2021 |
| United States | 7–10% | National health interview and NHANES syntheses, 2016–2021 |
| Global (WHO aggregated) | ~4–6% (varies widely) | WHO global prevalence summaries, 2019–2021 |
Analysis: Australia sits at or slightly above global averages reported by WHO, and within the OECD range for high‑income countries (WHO and OECD syntheses, 2018–2022). Differences reflect measurement choices, healthcare access and social determinants.
Key takeaway: Use cross‑country comparison cautiously; Australia’s 12‑month prevalence is broadly similar to other high‑income countries but local social and service factors create important within‑country variation (WHO and national sources, 2018–2022).
Link Between Depression Prevalence and Treatment-Resistant Depression
Rising prevalence increases the absolute number of people at risk of treatment-resistant depression (TRD). We define treatment‑resistant depression as inadequate response to at least two adequate trials of evidence‑based antidepressant therapy (clinical guideline definitions; peer‑reviewed consensus, 2015–2022).
Population risk: if 12‑month prevalence is 6% in a population of 25 million adults, ~1.5 million adults may experience clinical depression in a year; conservative TRD incidence estimates (clinical cohorts) place 10–30% of treated cases as meeting TRD criteria at some point (clinical cohort studies and hospital series, 2010–2022). That implies tens to hundreds of thousands of Australians living with TRD at any time.
Clinical implications: higher prevalence → larger TRD caseloads → greater demand for specialist services, neuromodulation, and complex pharmacotherapy pathways. For detailed treatment pathways consult our pillar page on treatment for treatment resistant depression.
Chronicity and relapse amplify prevalence: recurrent courses inflate lifetime prevalence and increase the pool at risk for resistance. For clinical context on chronic cycles see understanding the depression cycle. For severe subtypes that often require specialised care see psychotic depression symptoms and treatment options.
Key takeaway: Even modest prevalence increases translate to large absolute increases in TRD caseloads; health services must anticipate higher demand for second‑line treatments and specialist interventions (clinical cohort studies and guideline definitions, 2010–2022).
Socioeconomic and Environmental Factors Affecting Depression Rates in Australia
Social determinants drive much of the within‑country variation in prevalence. Below are enumerated factors with evidence type and directional effect.
- Unemployment and income insecurity — increases 12‑month prevalence by 1.5–3x in cohort and cross‑sectional studies (national disadvantage analyses and longitudinal cohorts, 2015–2021).
- Housing stress and homelessness — aggregated service data show very high rates of depressive symptoms in these populations; estimates exceed general population prevalence by multiple factors (community service data and targeted surveys, 2016–2020).
- Rural health access — limited mental health workforce and distance to services elevate untreated prevalence and chronicity (regional health service data and government access reports, 2017–2021).
- Cultural and language barriers — linguistically diverse communities show variable measured prevalence but consistent access gaps; Indigenous communities face compounded historical and social risk factors (targeted surveys and community health reports, 2015–2022).
- Life course stressors — adverse childhood experiences, intimate partner violence and chronic physical illness increase lifetime and 12‑month prevalence in cohort studies (longitudinal and clinical cohorts, 2010–2020).
- Environmental shocks — bushfires, floods and pandemic-related disruptions produced short‑term prevalence spikes in affected regions (post‑disaster community surveys and cohort follow-ups, 2019–2021).
Biological context for these findings is discussed in our detailed pathogenesis resource: pathogenesis of depression explained. Socioeconomic links to specific subtypes, including atypical presentations common in disadvantaged populations, are explored in atypical depression symptoms and treatment options.
Key takeaway: Social determinants (employment, housing, rurality, cultural factors) are among the strongest and most actionable predictors of higher local prevalence; policies targeting these areas will affect national prevalence and chronicity (government and cohort evidence, 2015–2022).
Implications of Depression Prevalence Statistics for Clinical Practice and Public Health in Australia
High prevalence has direct implications for workforce planning, guideline implementation, and prevention. Below we translate statistics into service‑level considerations and recommendations grounded in evidence syntheses and clinical guidance.
Service demand and resource allocation
Using a conservative 6% 12‑month prevalence and adult population ~20 million, ~1.2 million adults may need clinical care in a year; with 10–30% becoming TRD, health systems should budget for substantial specialist referrals, psychotherapy capacity and neuromodulation resources (AIHW and clinical cohort extrapolations, 2017–2022).
Policy impact: jurisdictions that invested in stepped‑care models and primary care‑led psychological services reported improved access and reduced waitlists; modelling studies suggest targeted investment in youth mental health yields the highest return in reduced prevalence and chronicity (policy evaluations and economic modelling, 2015–2022).
Clinical practice implications
Clinicians should expect:
- High co‑occurrence of anxiety and substance use disorders — screen routinely (clinical guideline recommendations and cohort studies, 2015–2021).
- Greater need for follow‑up and relapse prevention in high‑prevalence subgroups (guideline syntheses and recurrence cohort data, 2010–2020).
- Increased referrals for patients not responding to first‑line treatments; consider earlier access to specialist assessment for social determinants and complex comorbidity (clinical practice guidelines and TRD cohort studies, 2015–2022).
For treatment outcome expectations and recovery trajectories consult can depression be cured? informational guide and for evidence‑based MDD strategies see major depressive disorder treatment guide. Relapse prevention resources are available in severe depression relapse risks and prevention guide.
Prevention and public health strategy
Population strategies that have measurable impacts include: youth early‑intervention programs, workplace mental health initiatives, targeted supports for populations with housing and income insecurity, and place‑based rural service investments (policy evaluations and program reports, 2015–2022). Modelling shows these reduce prevalence and downstream TRD caseloads.
Key takeaway: Translate prevalence figures into capacity planning: assume hundreds of thousands will require clinical care annually and allocate stepped‑care, specialist pathways and social supports accordingly (AIHW modelling and policy evidence, 2017–2022).
How we assessed this
We synthesised publicly available Australian government survey reports (ABS and AIHW syntheses), peer‑reviewed cohort and clinical studies, and WHO/OECD comparative data. We prioritised recent national household surveys and guideline documents, noted measurement differences (screening vs diagnostic interview) and cross‑checked administrative data for service‑use patterns. Estimates are presented as ranges where methods diverge.
What the numbers mean for you
Below are concrete recommendations for clinicians, health planners and individuals interpreting these prevalence figures.
- Plan capacity to serve >5% of the adult population annually with depression services; build pathways for the 10–30% who may become treatment resistant (service planners; AIHW/clinical data, 2017–2022).
- Prioritise screening and early intervention for adolescents and young adults, given their higher measured 12‑month prevalence (school and primary care programs; national surveys, 2018–2022).
- Integrate social determinants into care pathways: assess housing, employment and family stressors as standard practice (clinicians and case managers; cohort evidence, 2015–2022).
- For patients not responding to two adequate evidence‑based treatments, expedite referral to specialist services and consider multidisciplinary assessment for TRD (clinician action point; guideline consensus, 2015–2022). treatment for treatment resistant depression
- Support population‑level prevention (workplace, school, community) to reduce incidence and long‑term burden (public health planners; program evaluations, 2015–2022).
Conclusion: Australian prevalence estimates — roughly 1 in 5 lifetime, 5–9% 12‑month — indicate substantial and persistent burden. These figures translate to large service demands and a meaningful pool at risk for treatment‑resistant depression. Data show clear demographic and socioeconomic gradients; targeted early intervention and resource allocation can reduce chronicity and improve outcomes. For practical next steps, contact a clinician if you are concerned about symptoms and consult national resources for service navigation.
If you want specific clinical pathways for treatment resistance, see our pillar page on treatment for treatment resistant depression for medication and therapy options.